El-Genesis is a fantastic way to simulate evolution on a grand scale, allowing for nearly limitless variations and continuous developments. Although the simulation is relatively simple, a new version—version 3—will soon be released, opening up a universe of possibilities. 😉
In the meantime, version 2.5 should more than suffice. So, how exactly do we visualize the evolution of these animals over generations? It’s actually quite straightforward when broken down. We simply assign unique values to each section of the genetic sequence, then use those values to create an RGB colour via an algorithm. We then use this RGB colour to visualize changes from previous generations.
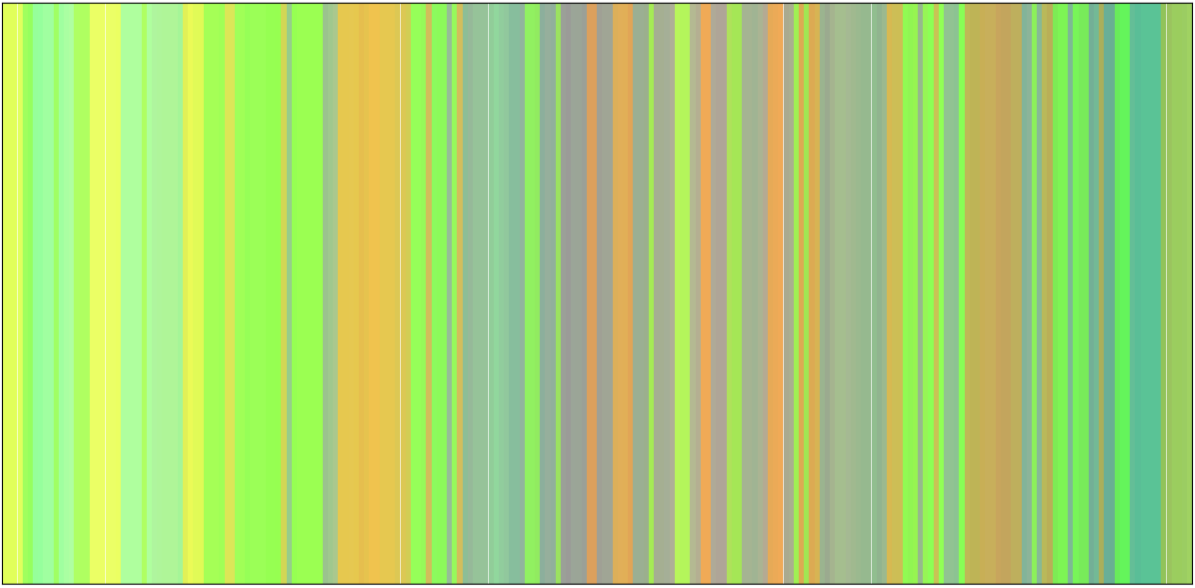
This method works best with a large number of animals, as it clearly shows how changes become visible over generations. Here’s an example!
Now, to explain the image above:
The image displays the genetic sequences of thousands of animals across hundreds of generations, allowing us to visualize changes in a species over time and identify when a subspecies or an entirely new species emerges.
In the example above, we observe a carnivorous species evolving primarily in aspects like speed, range, and vision. By comparing different generations, we can see certain colours repeating across multiple generations in specialized forms, while other offshoots with balanced parameters exhibit unique individual colours.

Leave a Reply